
As a researcher, I work with data all the time. I prefer qualitative data, like interviews and observations, because those data align with my commitments to putting people first in my research. But this week, especially, I’m reflecting on: what (are) data? data for whom? and for what purposes? Here are some musings and a resource for building a different kind of data talk.
Data by & for Black and Latinx families. In my NSF CAREER grant (PLANAR), the eight parent leaders that I work with are engaging in their own participatory action research projects to learn more about issues they care about and to explore ways to advance racial justice in elementary mathematics education. Data is front and center in that work. Some of the questions that parents are exploring are driven by the way data are used to marginalize Black and Latinx children in mathematics, especially standardized testing. And it has been amazing to see the ways that parents are imagining new possibilities for data that tell the stories of their and their children’s experiences and as they use data to understand the stories of others in their communities. I can’t wait for them to begin sharing these stories.
Data through & for arts and connection. Just this week, I read Jared Huisingh‘s dissertation and attended his defense, and I was inspired to find new ways of putting people first in my research. Dr. Huisingh dissertation is titled, “English teachers’ perceptions of media and identity in a post-truth world: An arts-based qualitative study using comic making as method.” All of the findings for the dissertation were presented as comics. I was moved by the way that Dr. Huisingh described how the process of creating the comics helped him to know his participants differently, and the resulting art supported all of his participants (teachers) to feel seen in important ways. Art helps us and those that we share it with to see data as humanizing. I was also motivated by Dr. Huisingh to sit with data in new ways… He described listening to interviews while walking his dog each day. I can’t wait to give this a try and see how I connect differently to the stories of my participants when I step away from my computer.
Data as art for connection at scale. I also just read an email from a colleague from Michigan State, Brittany Dillman. Dr. Dillman wrote to share a resource that made her think of this site because of the potential for teaching mathematics for social justice. The website: Dollar Street — photos as data to kill country stereotypes — greets you with this pop-up:
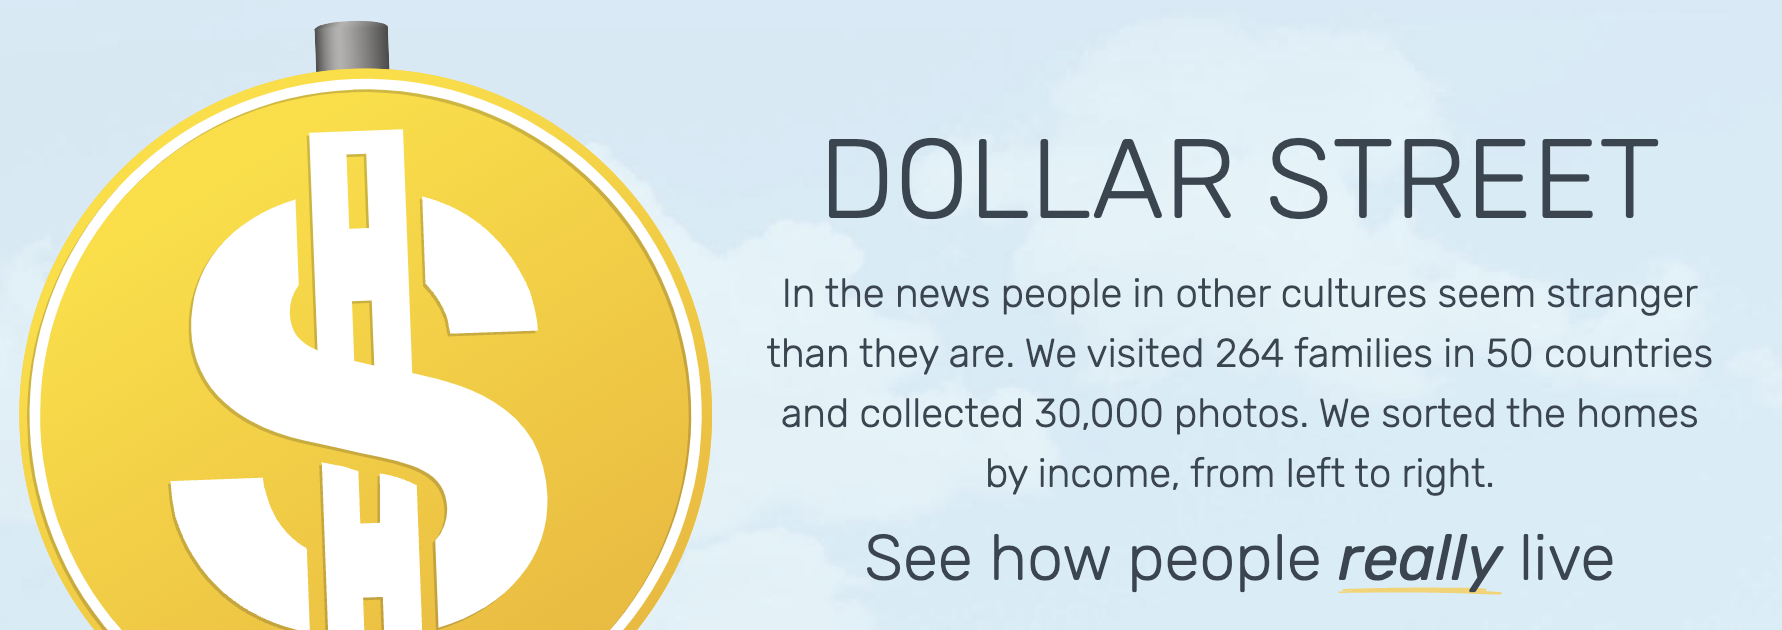
I found the site easy to navigate, and I quickly got lost in looking at all of the ways to create new data displays: by income levels, by global regions, and with different kinds of photos — homes, families, teeth!, and so on… So many possibilities for talking about data as photos! alongside issues of justice related to wealth inequality.
